Dr Harry Gibson

Geospatial Data Scientist
I'm an experienced geospatial software developer and data scientist. I currently work in the Oxford Martin School research programme on Informal Cities.
More About Me | Portfolio
LinkedIn | ResearchGate | Google Scholar
Demographic and Health Survey data processing
Reverse-engineering and recovering the relational structure of published survey data to transform the feasible scope of analysis
About the work
The Demographic and Health Surveys (DHS) Program is a US-based and funded organisation that conducts large-scale household surveys and makes the data available for research. Surveys are conducted around the developing world, from Afghanistan to Zimbabwe.
The surveys are large undertakings: each consists of several hundred questions that are asked of thousands of respondents. Questions cover everything from how many motorbikes are owned by a household, to the type of treatment a child had for fever. The surveys are a fundamentally important source of data not just to the Malaria Atlas Project but to many other researchers in global public health.
DHS provide many ways of obtaining the data. They are available (to registered users) in their raw form, and also as standardised summaries called “indicators” which give e.g. country-level aggregated summaries of variables such as malaria prevalence.
For most of the work we do, we need the raw data, tied to its spatial locations (which are published by the DHS as “cluster” points) - this enables the survey results at a location to be compared to covariate values in order to train the geostatistical models.
The challenge we face is processing the raw data from hundreds of surveys in such a way that we can extract common datasets across a wide range of surveys. DHS release the data in pre-assembled tables called “recodes”, which are effectively denormalised copies of the data. These tables have hundreds or thousands of columns and are hard enough to query systematically for a single survey, never mind joining results from multiple surveys. If we wish to extract information that is included in different recodes, it can be very hard to match the different subsets back together.
What I did
Alongside the “recode” data, which is available in flat-file formats such as Stata and SPSS, a further download format is available which DHS call a “hierarchical format”. It turns out that these are in the native format of the CSPro survey application and split the data into many logically consistent and more manageable tables.
I reverse-engineered this format, and wrote Python code which takes these data files and splits them into the individual tables. I further determined that once loaded to a relational database these tables can consistently be joined to one another to enable arbitrary queries to be constructed to extract whatever information is necessary. The code I wrote to obtain and pre-process the data into a relational database can all be found in this repository.
This work has meant that we can run extractions of DHS data across all their surveys with relative ease. This has enabled a lot of new research, which has led to numerous important publications. Below is a summary of a few recent examples:
Mapping changes in housing in sub-Saharan Africa from 2000 to 2015
This study, published in Nature in 2019, models the prevalence of “improved” housing (that is, housing made from durable materials, with clean water and sanitation and sufficient space) across Africa over time.
The study was enabled by DHS data I extracted from 62 separate surveys across sub-saharan Africa. Based on the relational database I had reconstructed, from each survey I extracted information on household construction, sanitation, and size, and collated this into a single coherent dataset for use in the geostatistical modelling.
This study forms part of a series investigating housing quality, wealth factors, and the relationship they have with childhood health outcomes. The code I wrote for extracting the datasets used in all of these studies, along with further description, can be found here.
Treatment seeking rates in malaria endemic countries.
This study, published in 2016, models the rate of “treatment seeking” for fever. That is, when children have fever, how likely is it that they will receive medical attention, and what type of facility will they be treated at?
Because of how the information is structured in these surveys, with different questions every time, the SQL needed to extract the information into a standard output is different for every survey. So I wrote this as a two stage algorithm:
- Firstly the exact questions asked in each survey are extracted to a single table. This table is then edited by a researcher, to identify which question phrasings are of interest
- Next this table is used to generate SQL code specific to each survey. An FME workbench was used to read the table and write the SQL.
- The SQL was then executed for each survey in turn, producing consistent outputs for the modellers
The FME workbench which generates and executes the SQL files, and samples of the output it produces, can be found here.
This work has been regularly updated since the 2016 publication and it now forms a key part of the malaria modelling in the Global Burden of Disease study.
DHS Indicator Data reverse-engineering
The DHS publish a large number of “indicators” which are summaries of their data, aggregated to the national or subnational (regional) level. These are intended to provide a way of comparing information across surveys, as they are available in one place for a large number of the surveys, and can be downloaded through sources such as STATcompiler.
However as these indicators are aggregations they are not helpful for fine-scale spatial modelling. Although the DHS calculate the aggregated indicators themselves, they did not have the means to do so at a cluster level, and so the DHS asked us to do this on their behalf.
My work on producing a relational database of the raw survey data which can then be queried across surveys enables calculation of the indicators at the cluster (point) level, and so I reverse-engineered and calculated a number of their indicators at the cluster level. The code I produced is available in this folder.
These point estimates were then used in a geostatistical model to produce pixel-level continuous estimates for those indicators. Those pixel-level maps are now published by the DHS themselves on their Spatial Data Repository
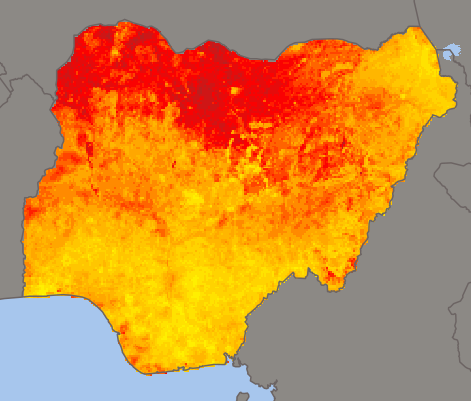
For example this image shows the percentage of children with stunted growth in Nigeria in 2013, based on the point-level indicator data I created: