Dr Harry Gibson

Geospatial Data Scientist
I'm an experienced geospatial software developer and data scientist. I currently work in the Oxford Martin School research programme on Informal Cities.
More About Me | Portfolio
LinkedIn | ResearchGate | Google Scholar
Mapping flood defences in the UK
Using FME to implement complex geoprocessing workflows
FME (Feature Manipulation Engine, produced by Safe Software), is what’s known as an ETL (Extract, Transform, and Load) tool. This is a generic term for a tool that allows reading (“Extract”) of data in one format, manipulation of the data (“Transform”), and then writing the data to (potentially) a different format (“Load”). The point of an ETL tool is to define a workflow that gets data from where it is, to where you want it, and once a workflow has been designed for a particular task it can be run repeatedly as new data or updates are produced.
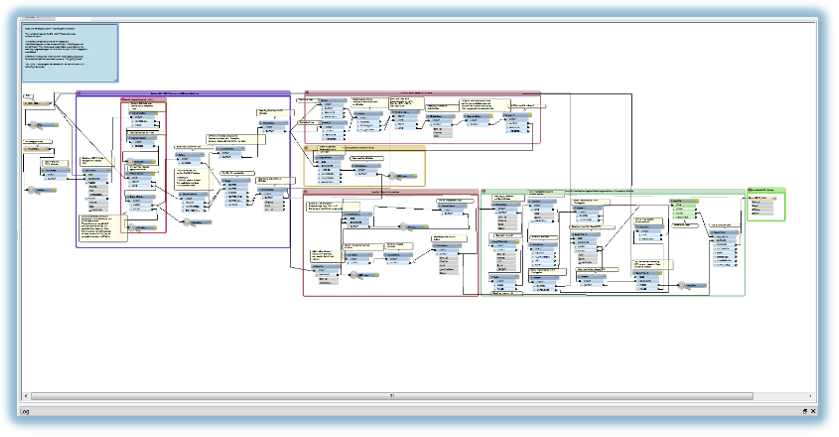
Uniquely among ETL tools, FME has a huge range of data formats that it can read and write, including almost all common geospatial formats. It also has a vast range of “transformers” which provide advanced geoprocessing capabilities. This means that it can be used to define and run almost any GIS data processing workflow, in a similar vein to ESRI Model Builder or the open-source GeoKettle, but with far greater speed and flexibility.
Whilst working at HR Wallingford, a major project I worked on from 2012-2014 was the production of a “Continuous (flood) Defence Line” (CDL), for use in the (UK) National Flood Risk Assessment. The flood model used to model where and when flood waters escape from rivers relies on having a unbroken line associated with each bank of every river, representing the “effective” flood defence, i.e. the highest feature near the river which would in practice be the point that resulted in a flood if water were to overtop it. Where real engineered flood defences exist, they should form the CDL, but elsewhere the CDL could be formed from railway embankments, the natural river bank, areas of high ground, etc.
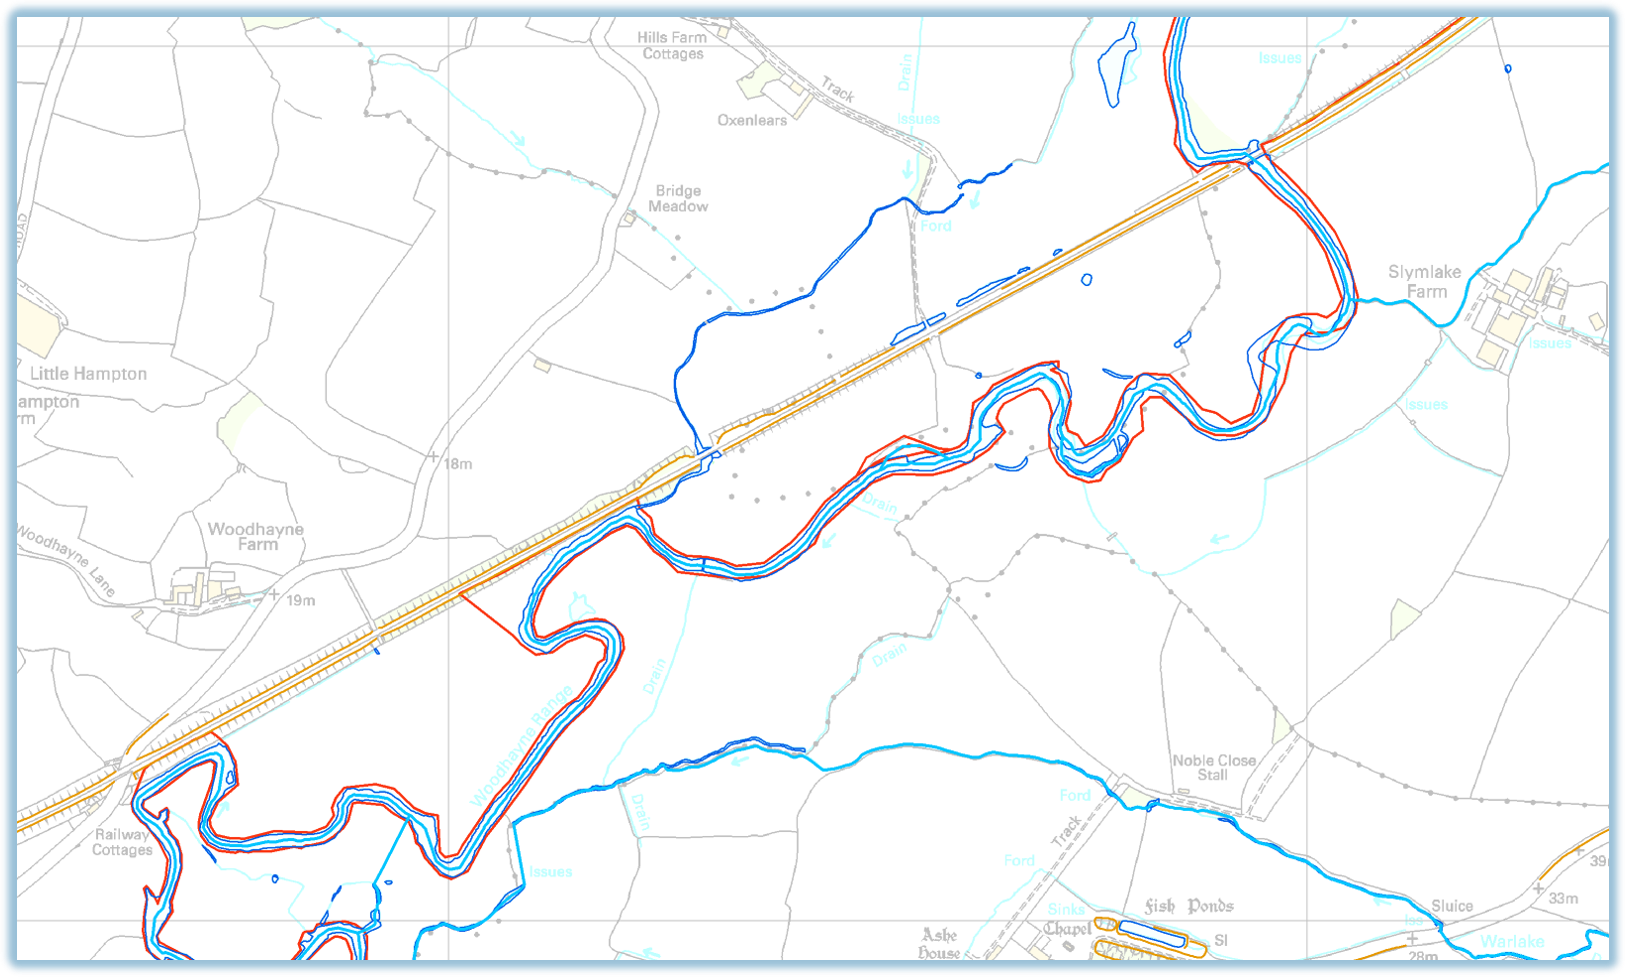
This problem was one of data integration: given numerous different polyline datasets, we have to create a series of unbroken continuous lines which each consist of parts selected from the existing datasets according to a given order of priorities. Where real flood defences exist, they should be used; where they do not then we want an intelligent “best guess” of the effective flood boundary selected from the other datasets such as river banks or railway embankments shown in OS MasterMap. All the lines must be connected into a continuous whole, and they must all be referenced to the segment of river that they correspond to.
I designed and implemented this processing chain using FME. Firstly there was an intricate, but conceptually-straightforward, series of pre-processing steps of clipping, intersecting, and nearest-neighbour allocation on all the incoming datasets. Secondly there was a harder step of making sure that all the lines could be connected to one another and then finding the combination which made best use of the flood defence lines.
This involved some lateral thinking. I realised that if we could create a “graph” from all the lines, and then weight them accordingly, we could use a shortest-path finder algorithm to find the “best” route. This is similar to what a satnav or Google Maps does to find the best route across the road network, for a given meaning of “best” (shortest, fastest, avoiding motorways, etc). Here, “best” would mean the route which used the flood defence lines as much as possible.
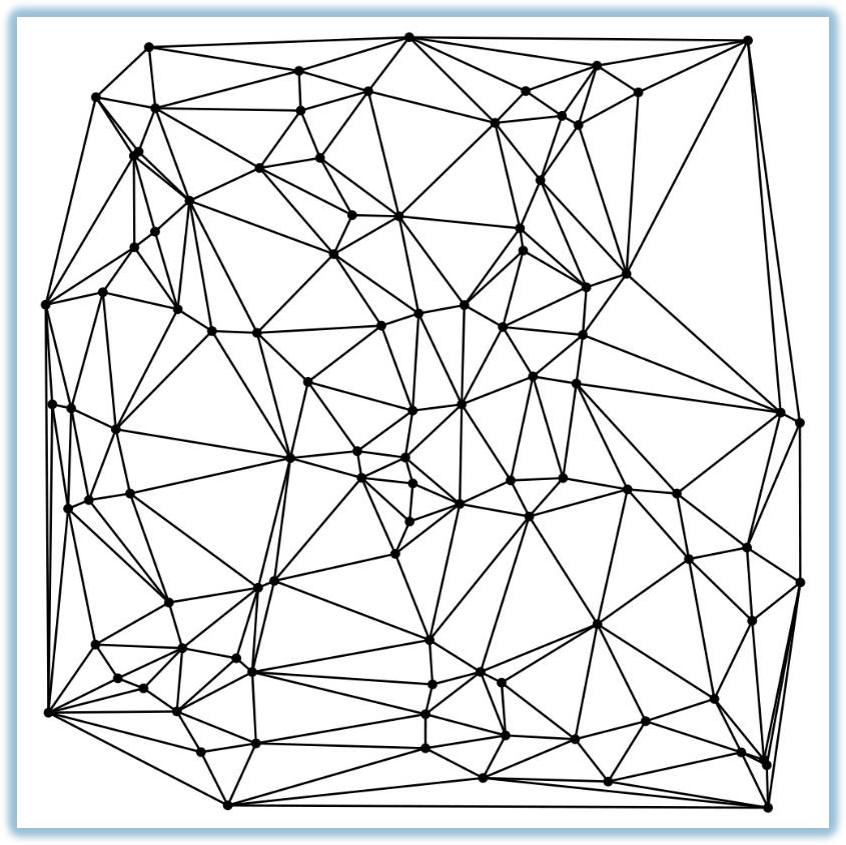
All of this was also implemented in FME. First I created the connected graph from the pre-processed lines, by breaking them at every intersection and then creating a Delaunay Triangulation (a TIN, for GIS people) of all the end points. Unnecessary edges were then removed, and the remaining ones were put into the mix along with all the flood defence lines, river banks, etc, but with a very high “cost” for the shortest-path finder. Next the top and bottom of each continuous “piece” of river were identified and from this, the start and end points for each Continuous Defence Line. Finally, Dijkstra’s Algorithm was used to find the best route from start to end point.
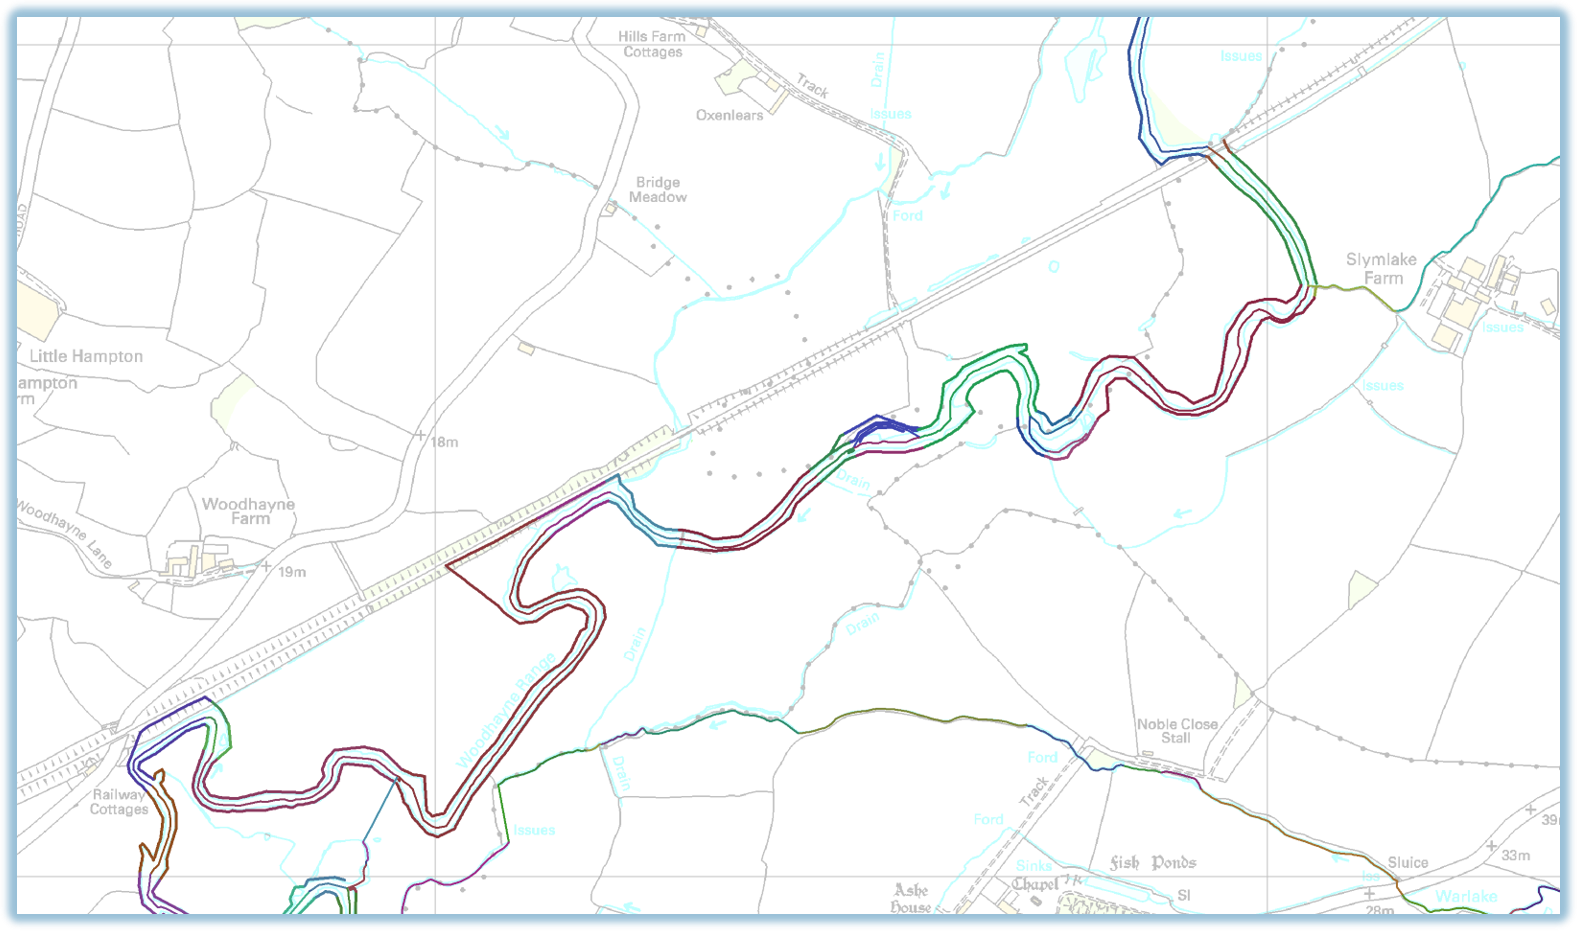
Because the rules about how the different lines should be combined and selected were the same everywhere, the same FME workflow could be used to process the data and produce the initial CDL across every river in England, despite the great variety in their characters. The output from the FME process could then be passed to the environmental managers who then had the much smaller task of making specific local corrections to the initial CDL, to encompass any particular local knowledge or rules.
This project was a fairly extreme example of the types of spatial data processing that can be done in FME. I presented the work at the FME World Tour user conference in London in 2014. The slides can be found here and contain a lot more explanation and illustrations of this interesting project.