Dr Harry Gibson

Geospatial Data Scientist
I'm an experienced geospatial software developer and data scientist. I currently work in the Oxford Martin School research programme on Informal Cities.
More About Me | Portfolio
LinkedIn | ResearchGate | Google Scholar
Seasonality of precipitation
Using Google Earth Engine to classify precipitation regimes for modelling malaria seasonality
Historically, continent-wide and global maps of malaria burden have been produced on an annual basis. The data that we have on malaria occurrence are often either only available annually, or are so sparse that we need to aggregate them to annual periods in order to have a usefully large body of evidence to create models from.
As more and better data become available there’s increasing interest in predicting malaria at finer time-steps, such as monthly, and thus getting a better understanding of the “seasonality” of malaria transmission. For example are there one, two, or more annual “peaks” in transmission? When do these occur?
This modelling will need new covariate datasets to support it. To support this I performed an analysis of how the seasonal patterns of rainfall vary, using Google Earth Engine.
This helps identify areas likely to have one distinct wet season, vs. having two or more wet seasons or having rainfall more-or-less evenly distributed through the year, as well as identifying when in the year the wet season tends to occur.
This information in turn can be compared to patterns observed in the seasonality of malaria incidence data.
The image below shows in purple and blue the areas most characterised by one wet season, vs. (in yellow and red) the areas characterised by two or more distinct wet seasons.
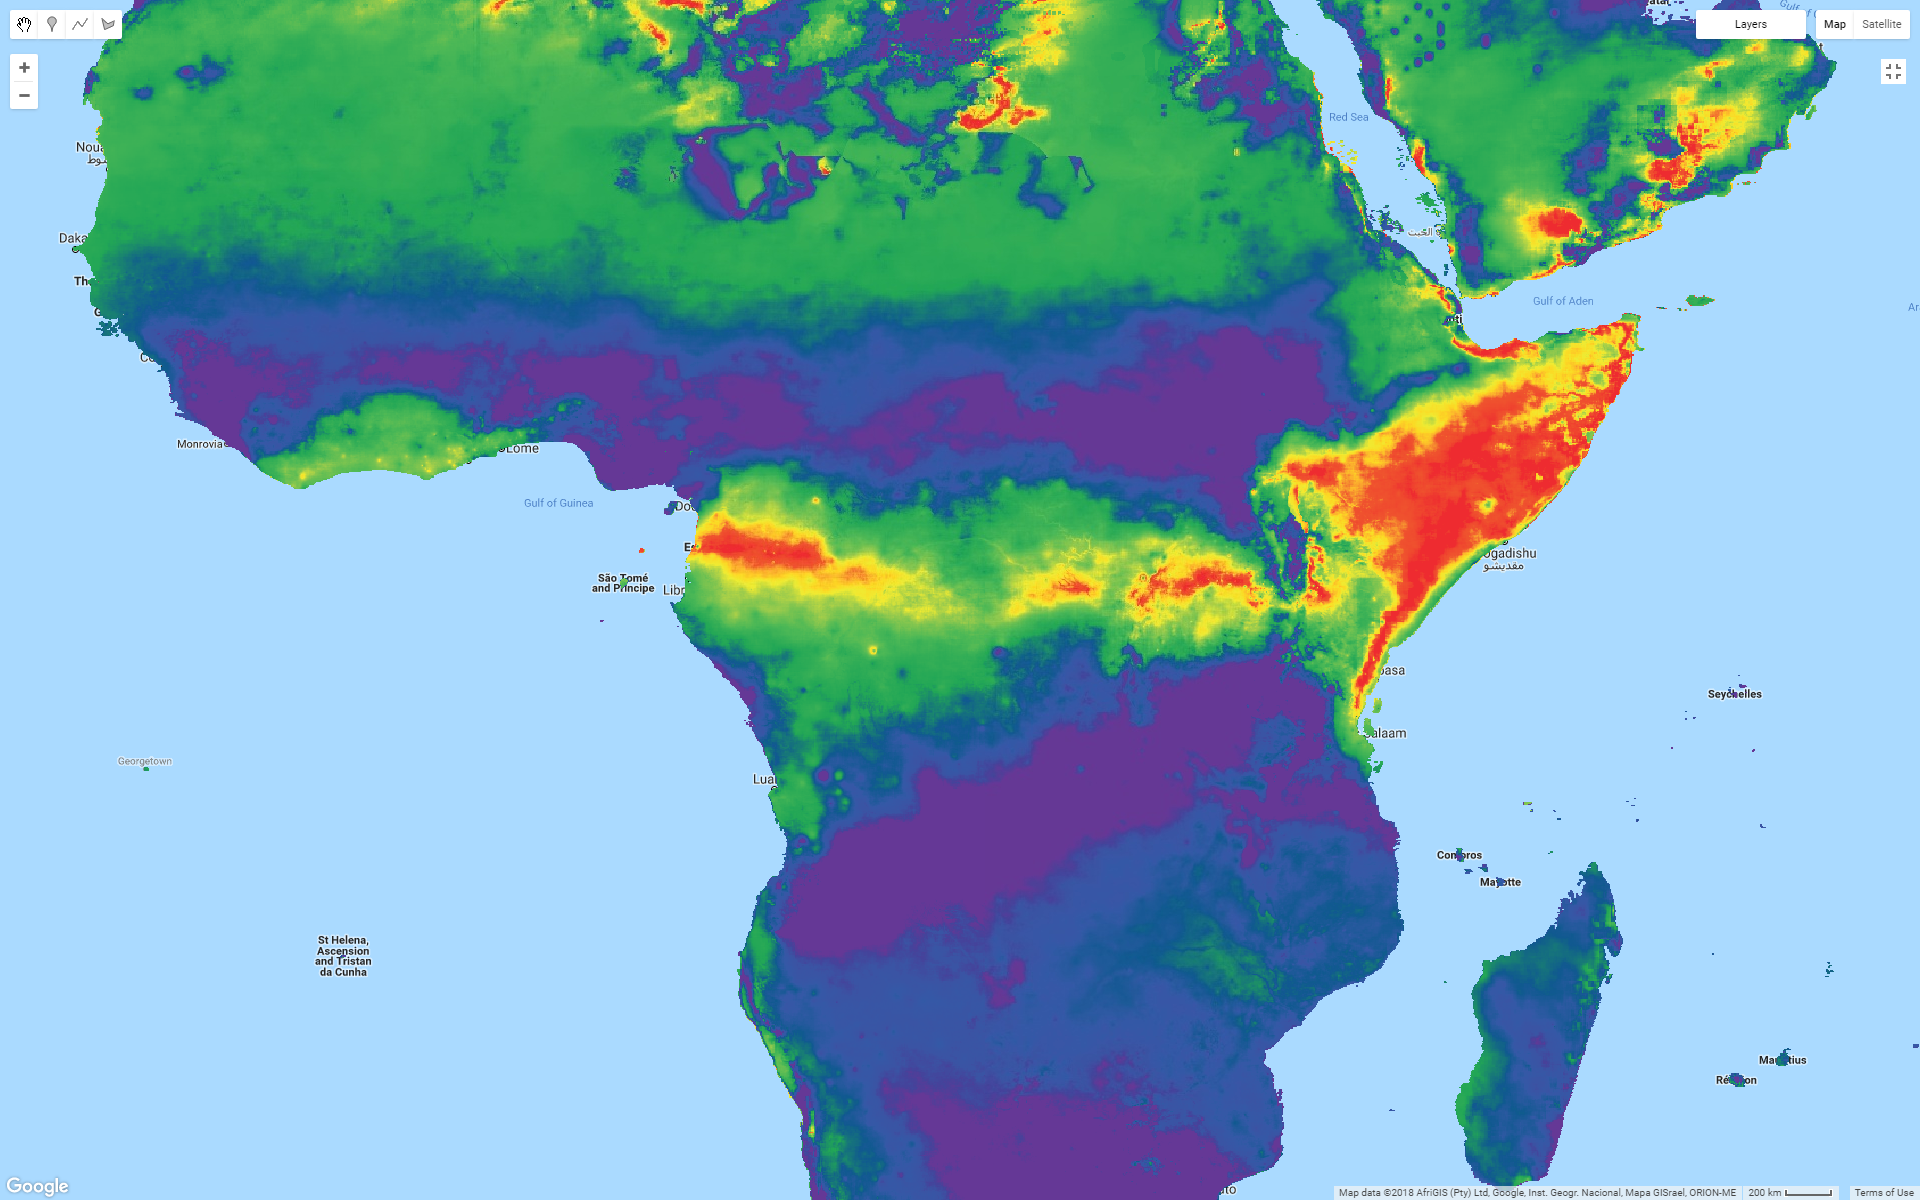
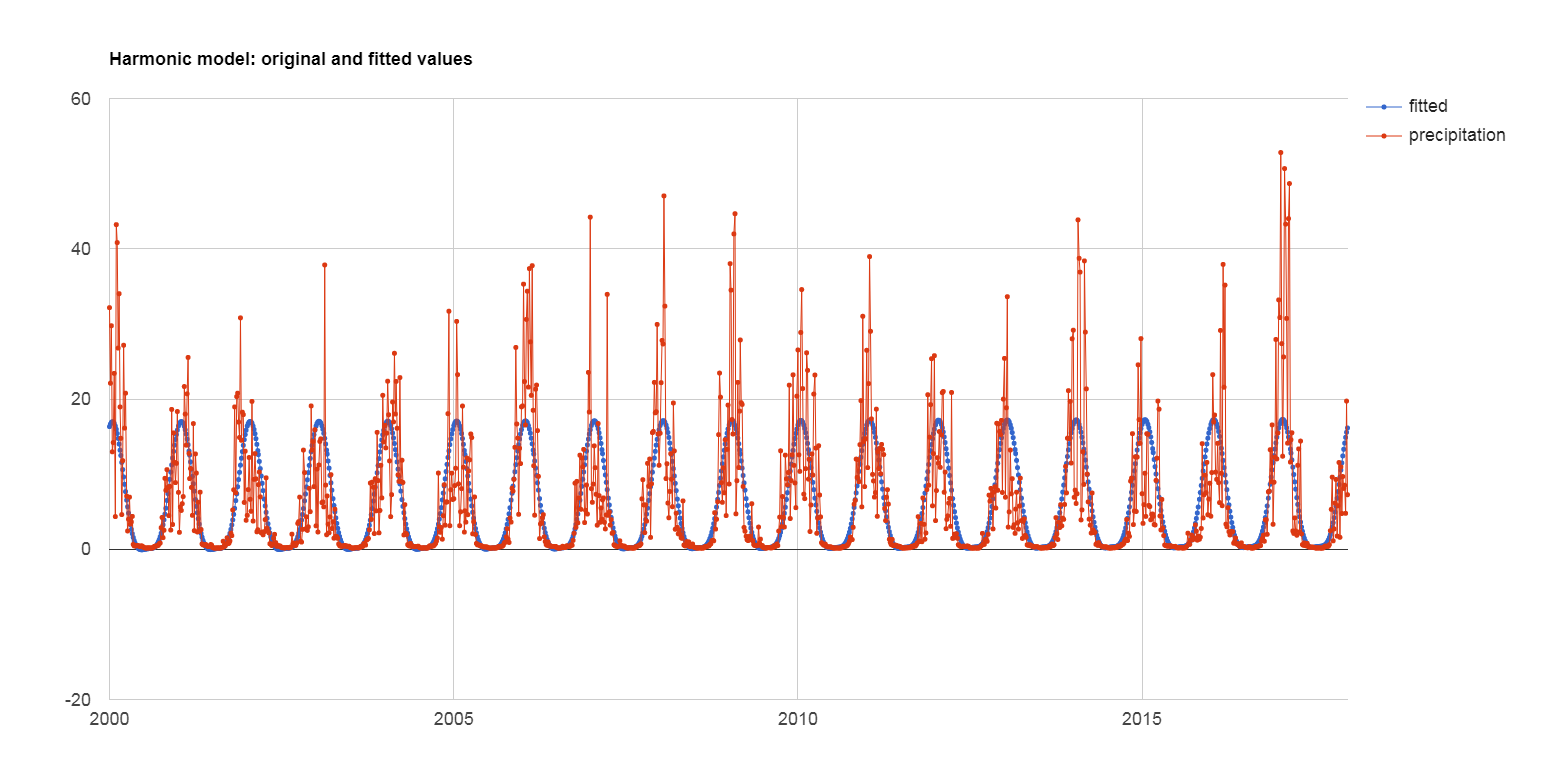
The basic method is taken from Liebmann et al (2012) and consists of creating annual and twice-annual harmonic variables. We then fit a regression model between the rainfall data and each of these harmonic variables, and compare the extent to which they each fit: e.g. areas with one distinct wet season will have a better fit to the annual harmonic variable. Areas without a good fit to either variable are likely not to have distinct wet seasons.
The Earth Engine code for this analysis can be viewed here (you need to have access to Earth Engine to view - if you don’t then you can see a snapshot here).
Having identified the areas with a single wet season, next we find the time of year that the wet season begins. I implemented the algorithm from Liebmann et al (2008) with this code (Earth Engine access required - view a snapshot here if no access), which demonstrates use of array pixels to effectively attach metadata to individual pixels within an analysis in Earth Engine.
One advantage of Google Earth Engine is that a range of different precipitation datasets are readily available. The example shown here uses the CHIRPS dataset, which is valuable as it has a long period of record.